01
Load market data and averages
Add the market data node, then create two moving-average nodes. Keep fast and slow periods editable so they can be tested later.
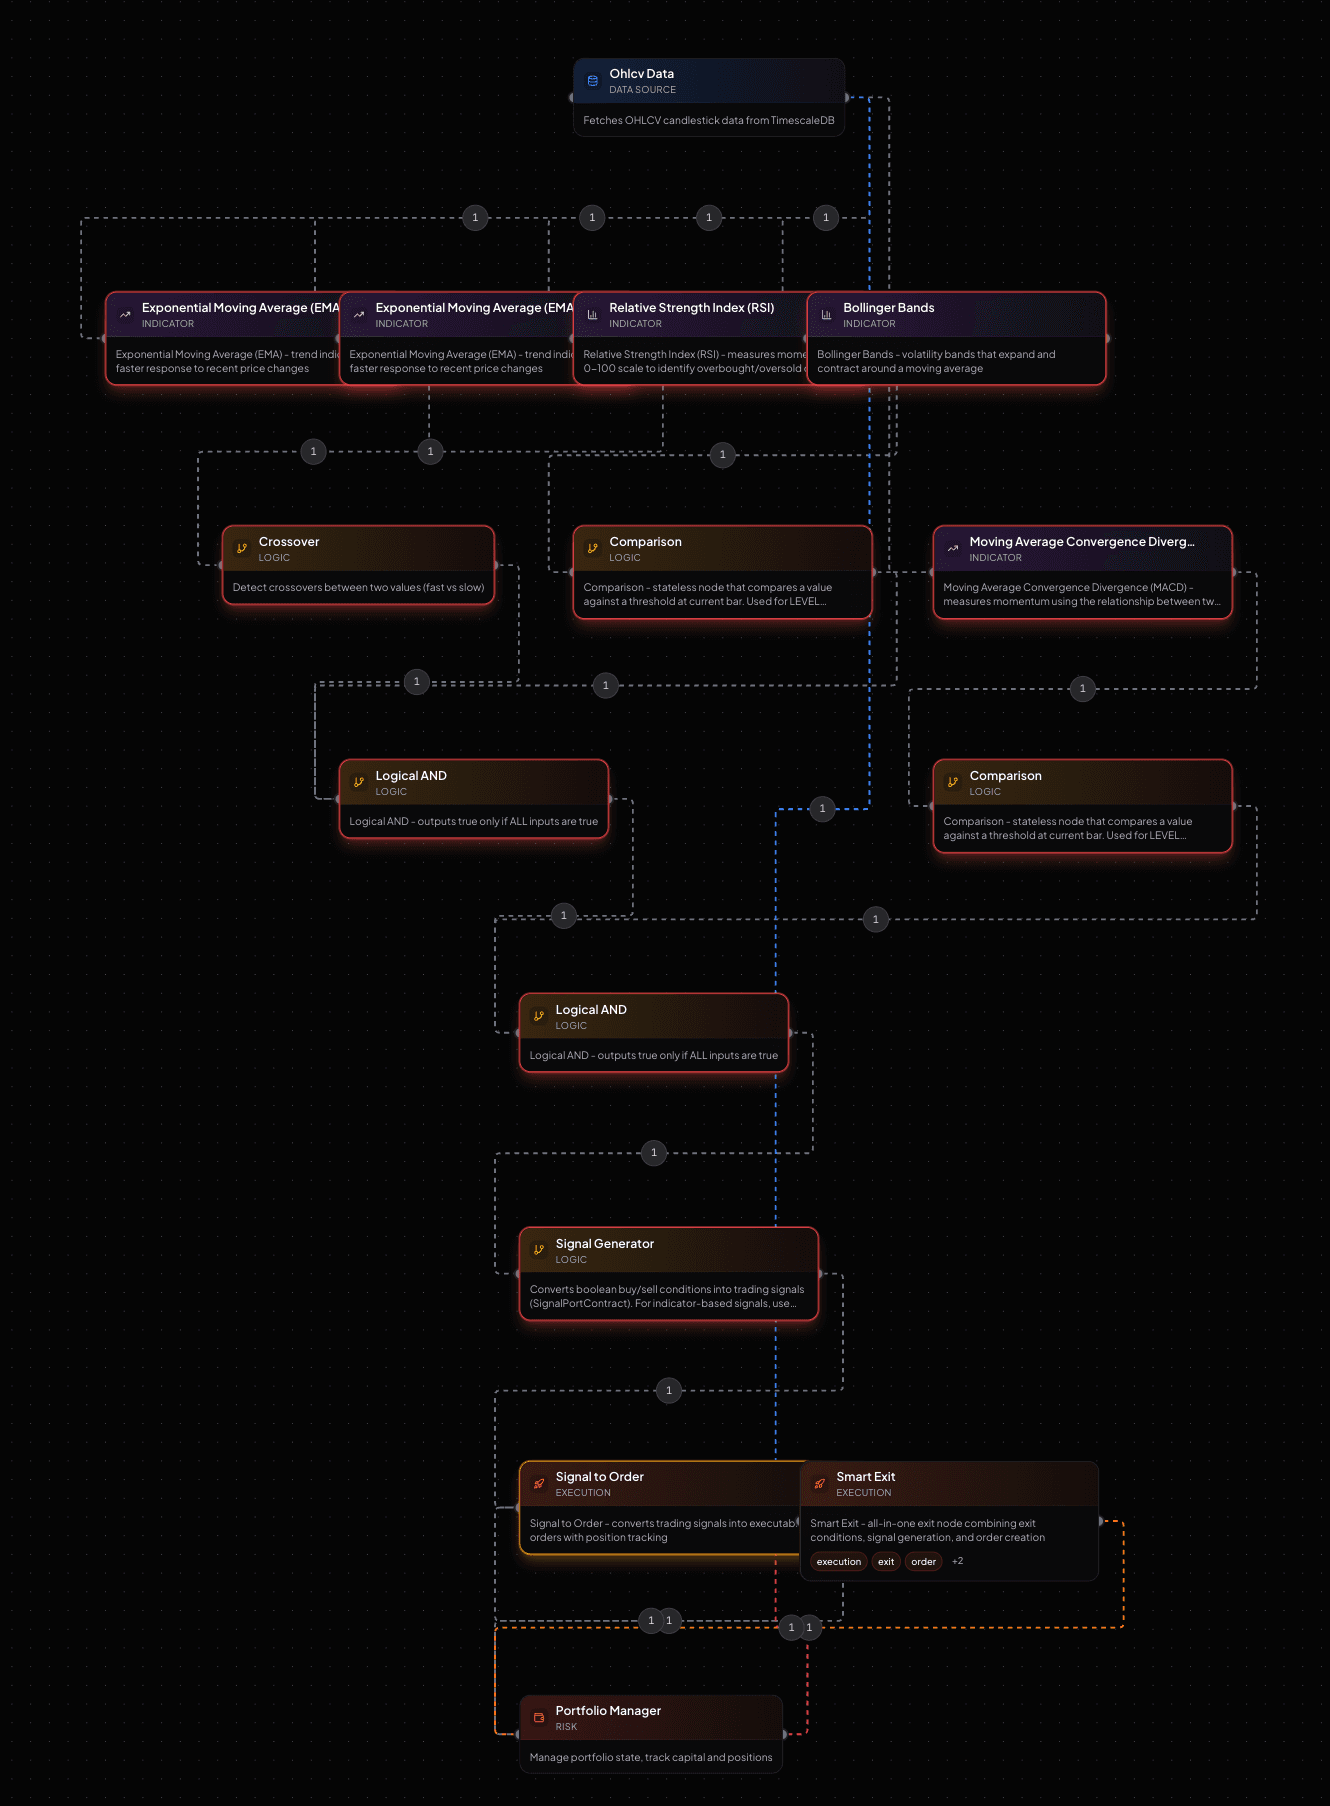
Create a moving-average crossover workflow, customize the fast and slow periods, and review whether the behavior is stable enough for paper trading.
Build a visible crossover strategy that separates trend signal, exit logic, and risk controls.
01
Add the market data node, then create two moving-average nodes. Keep fast and slow periods editable so they can be tested later.
02
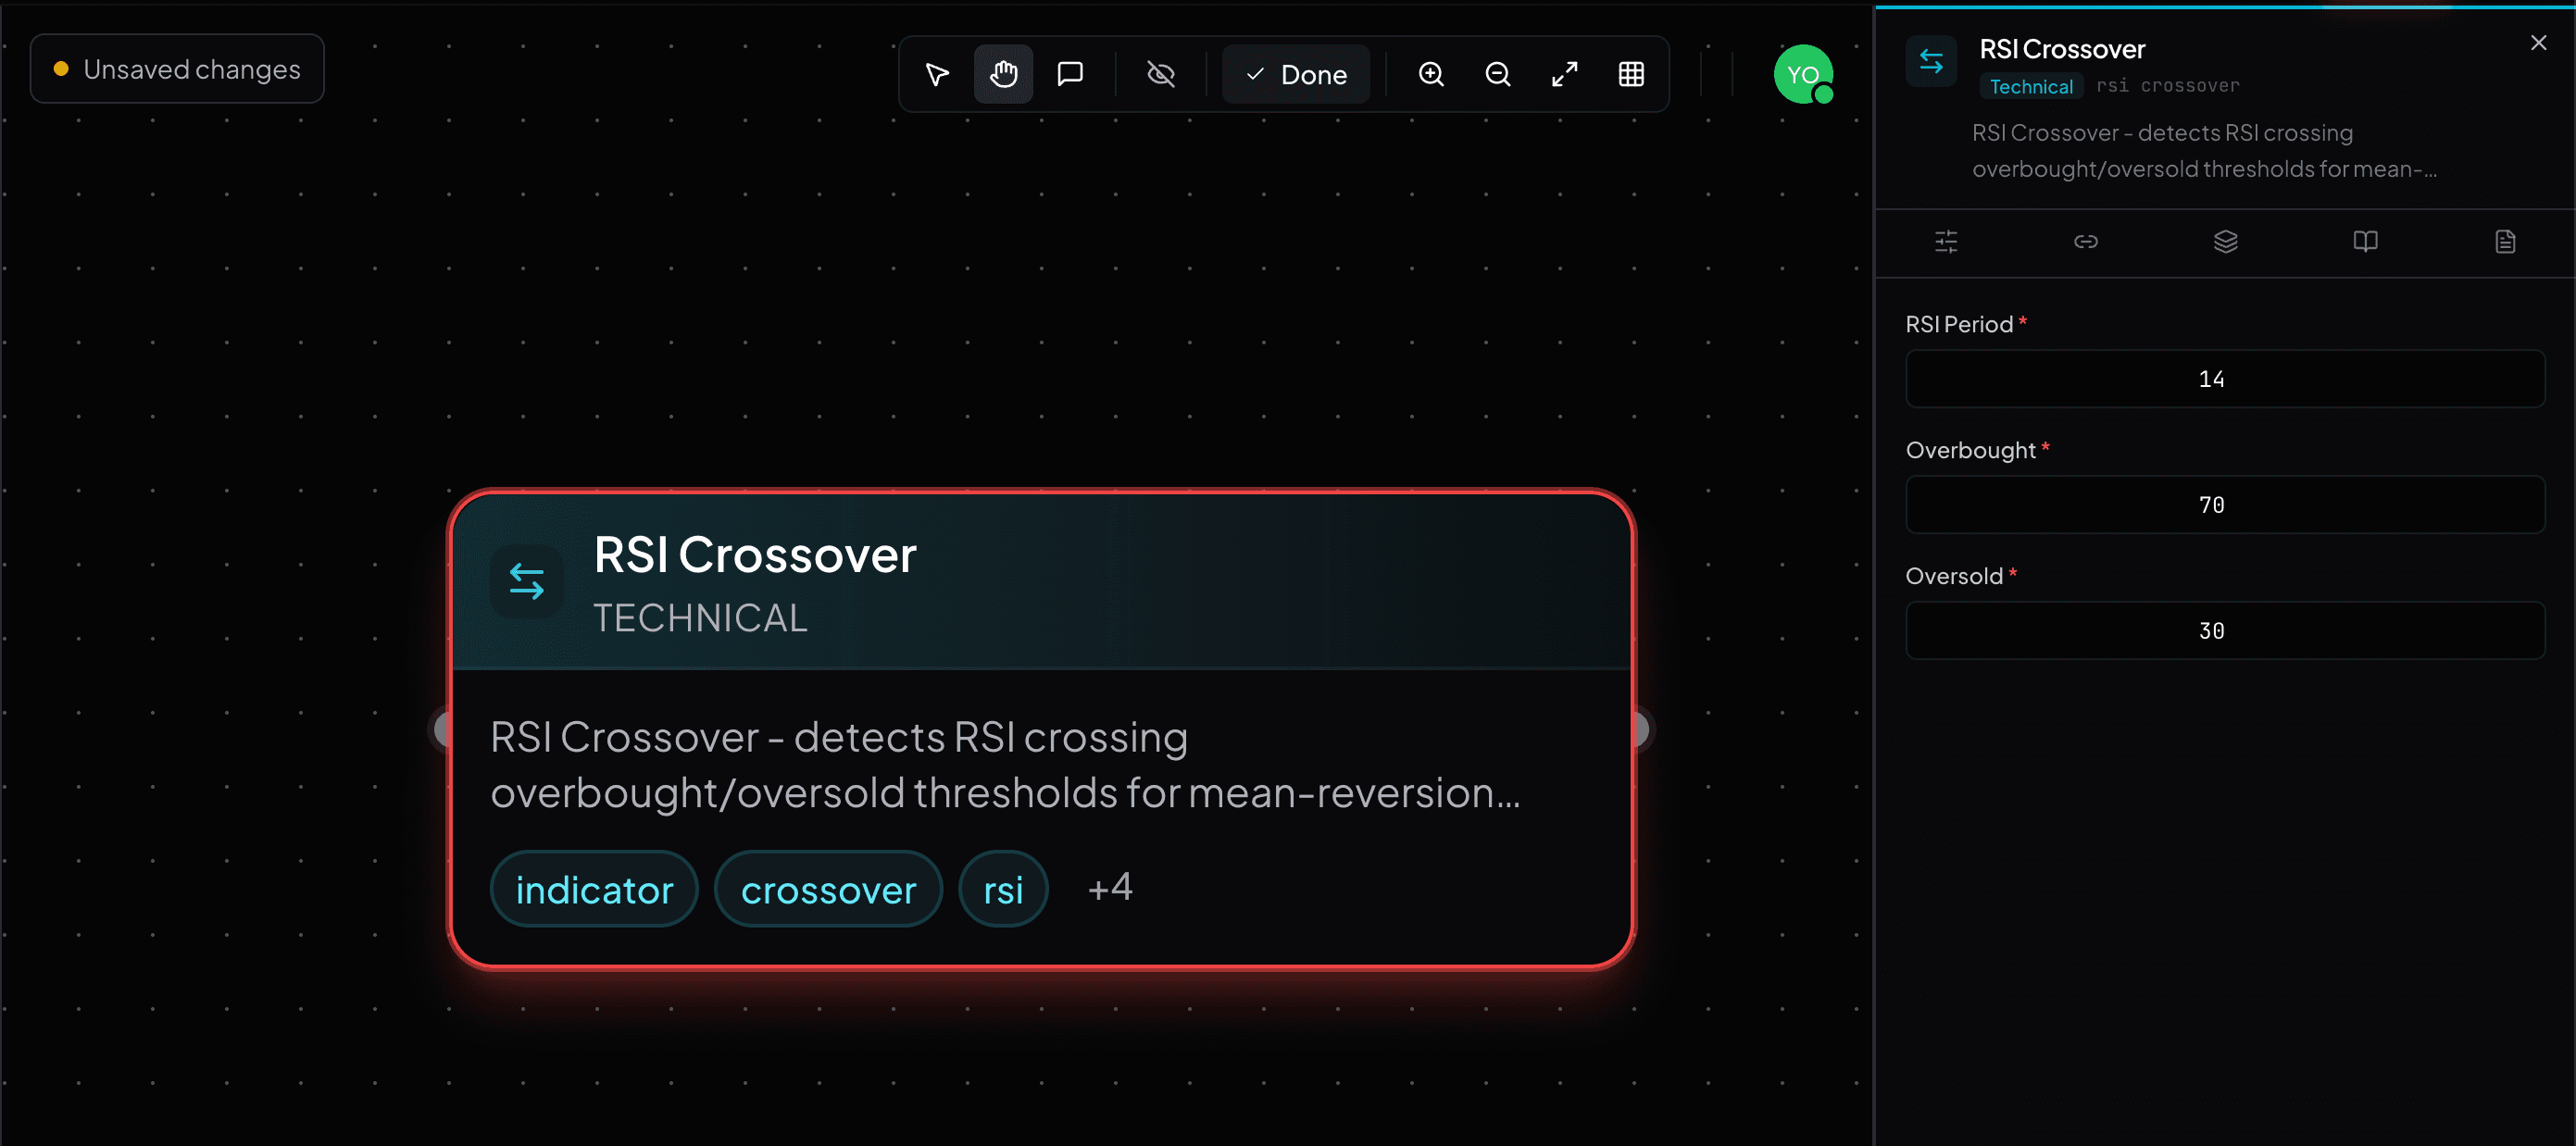
Use crossover nodes so the signal fires on the crossing event instead of every bar where one average remains above the other.
03
Run the draft only after fee, slippage, date range, and position sizing are explicit. Do not treat one backtest as proof of future performance.
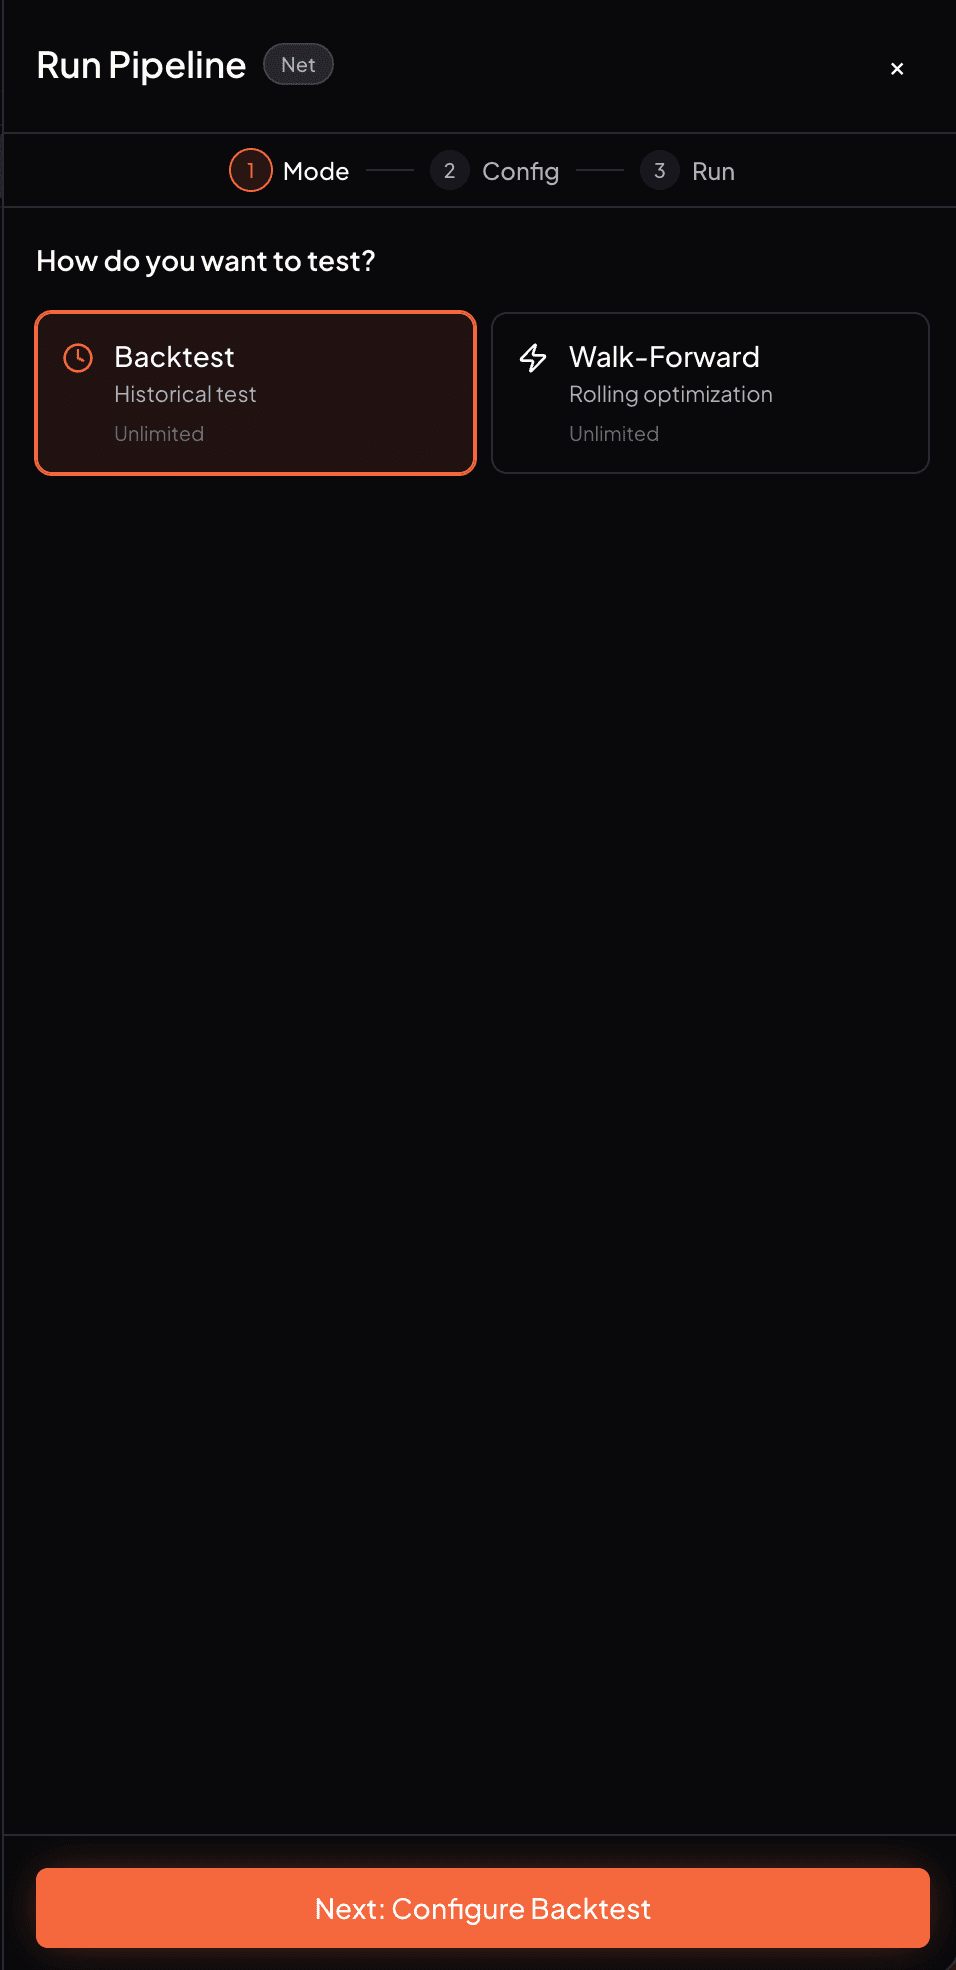
Backtest assumptions
How to interpret the result
If the crossover is too noisy, personalize periods or add filters before paper trading.
Moving-average examples are common educational workflows, not trading recommendations.
Tutorial FAQ
Yes. Vantixs lets you personalize the fast and slow periods on the canvas. The important step is to test whether those settings remain stable rather than optimizing them for one perfect historical window.
Crossover nodes represent the event of one series crossing another. That is safer than a simple greater-than comparison, which can stay true across many bars and create repeated signals.