01
Start from the visual builder
Open the strategy canvas, add market data, and keep the instrument and timeframe explicit before adding indicators.

Create a simple RSI workflow, personalize the thresholds, run an example backtest setup, and decide what to paper trade next.
Build a visible RSI strategy draft that can be inspected before any live-capital decision.
01
Open the strategy canvas, add market data, and keep the instrument and timeframe explicit before adding indicators.
02
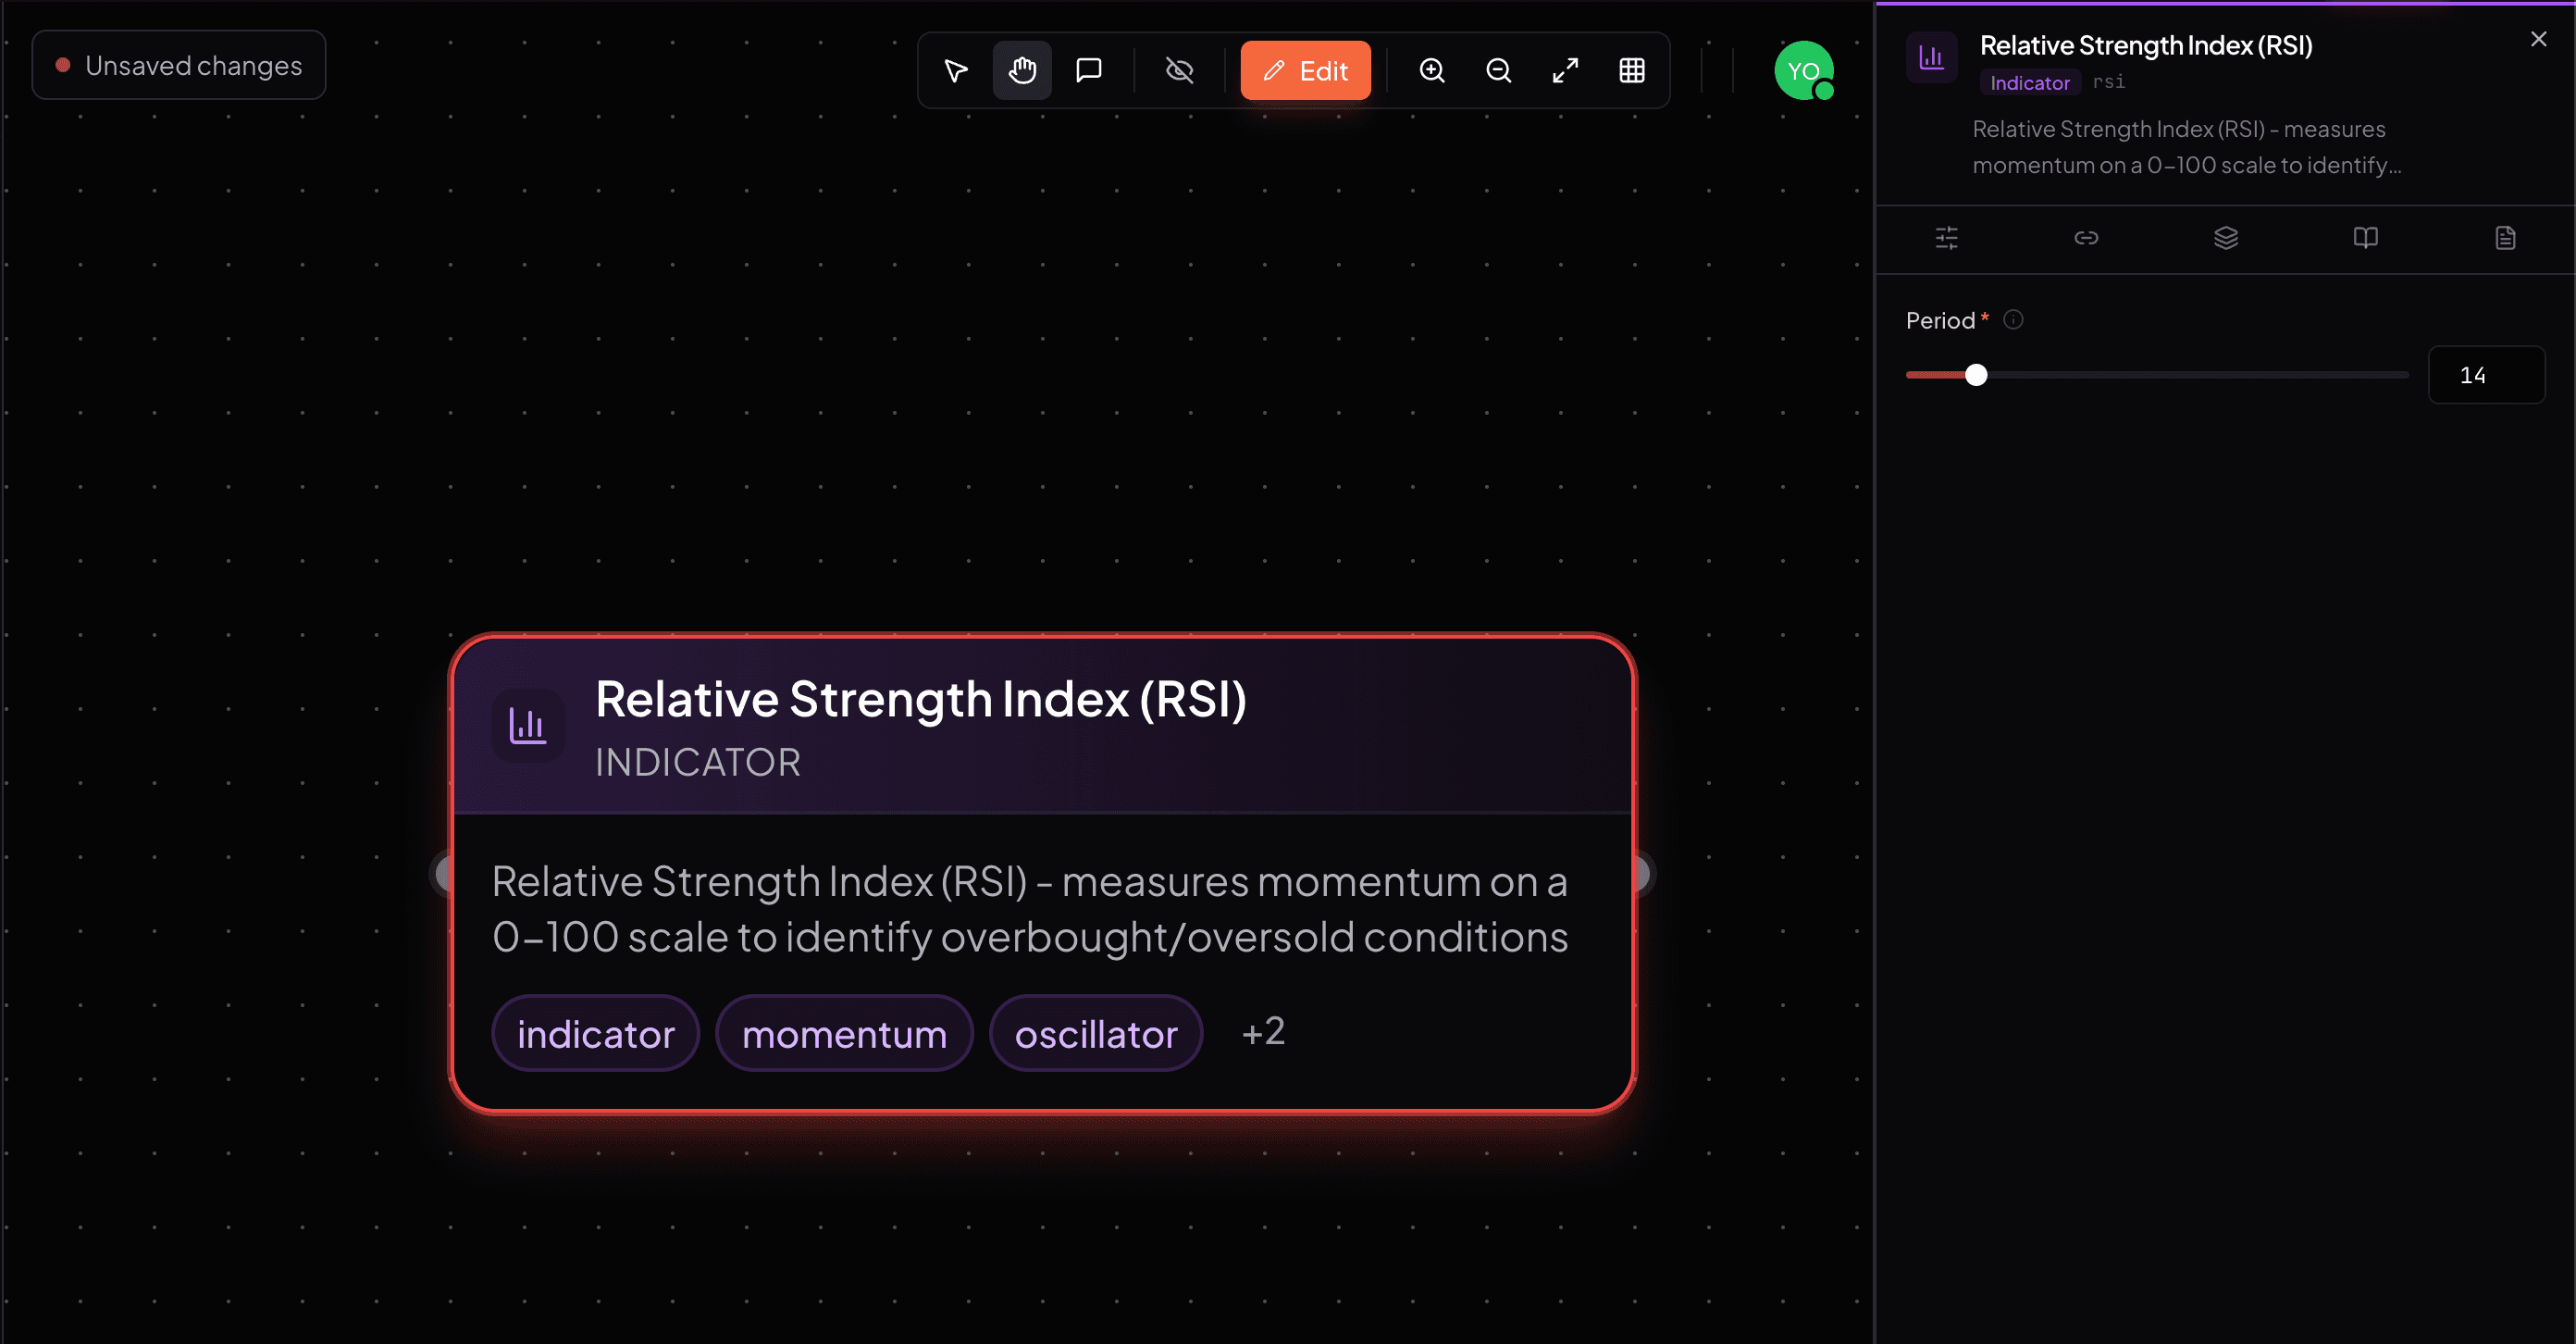
Add an RSI node, set draft thresholds, and connect the signal to entry and exit logic. Treat the first values as assumptions to test, not final settings.
03
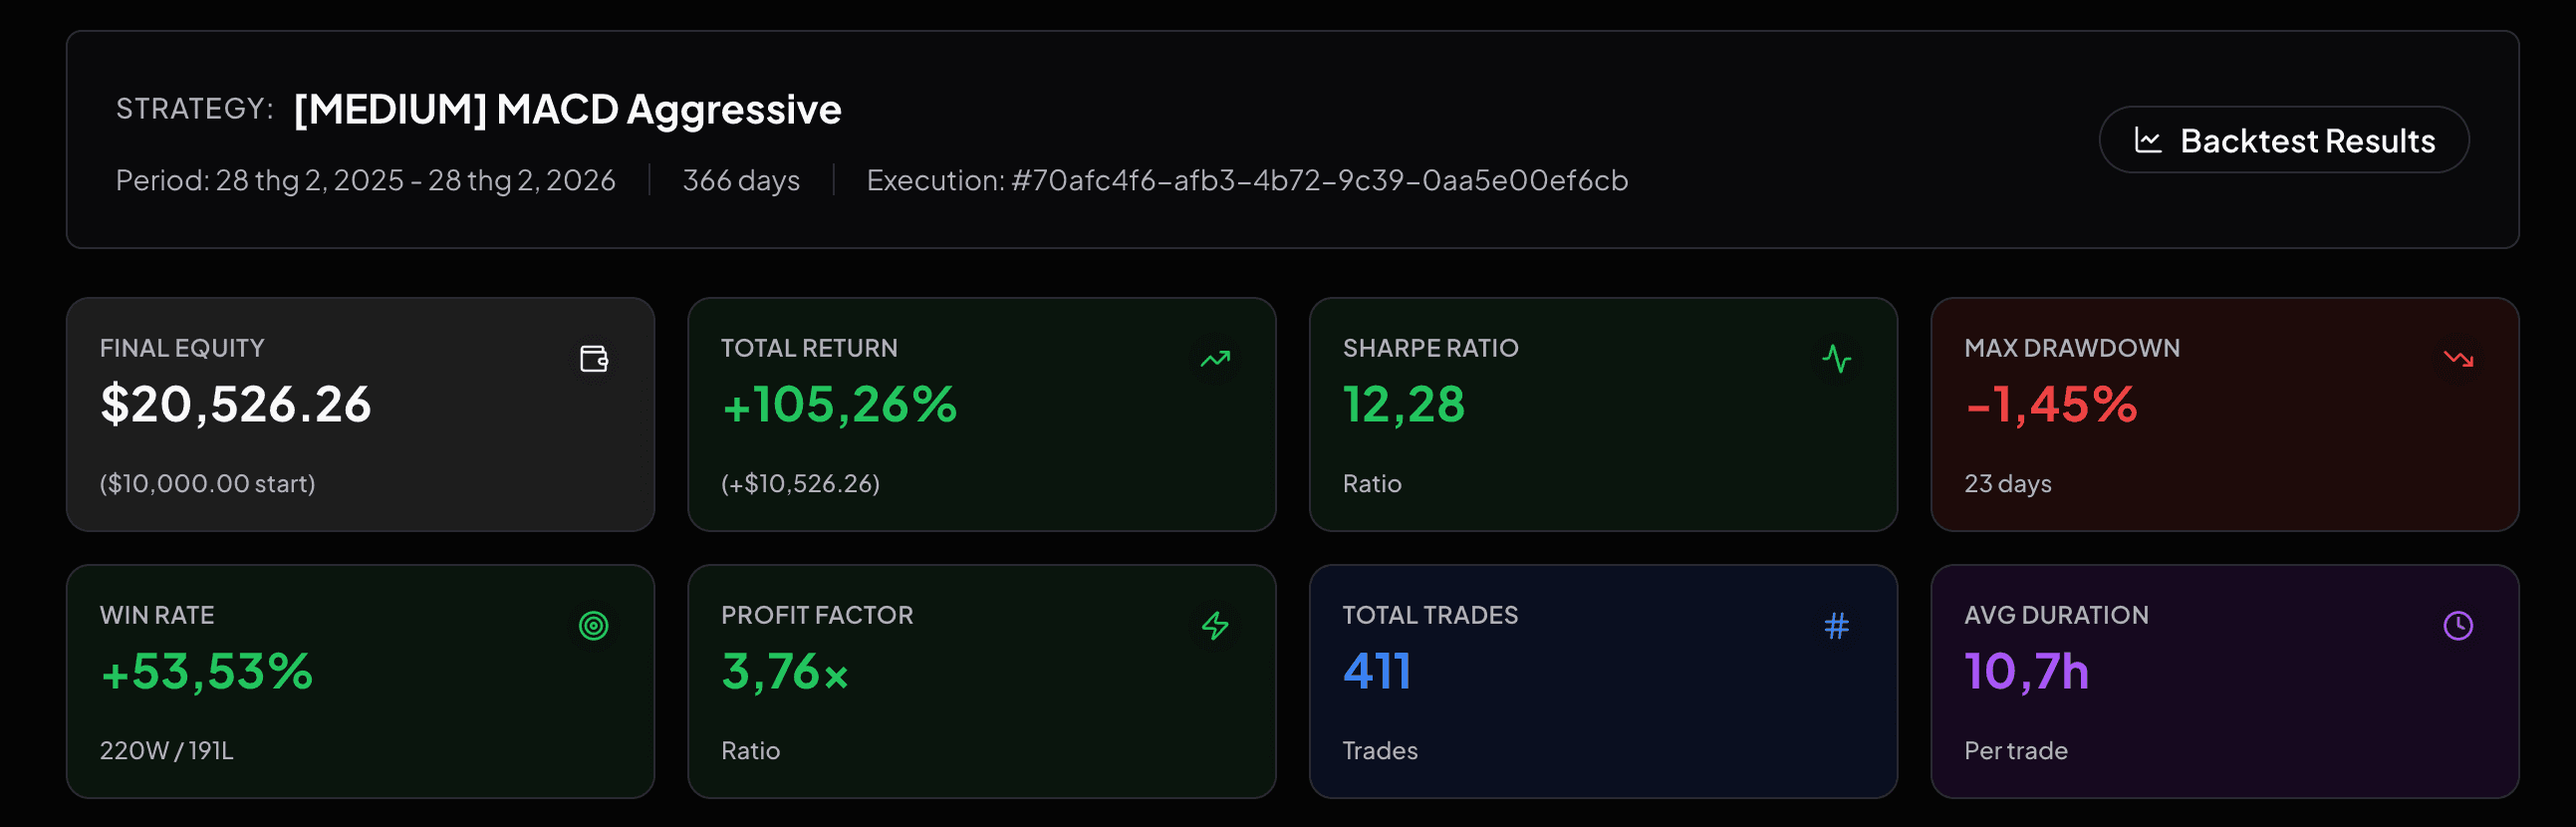
Use a documented symbol, timeframe, fee, and slippage assumption. This page does not publish return claims because the result must come from a verified run.
Backtest assumptions
How to interpret the result
Paper trade only after the backtest behavior looks explainable and the risk rule is visible on the canvas.
This tutorial is educational. It does not recommend RSI settings or promise profit.
Tutorial FAQ
Yes. The workflow is designed so beginners can see the market data, RSI condition, entry, exit, and risk rule as separate pieces instead of writing code.
No. It shows the workflow and the validation assumptions. Vantixs should only publish result numbers when the exact symbol, timeframe, date range, fee, and slippage settings are verified.